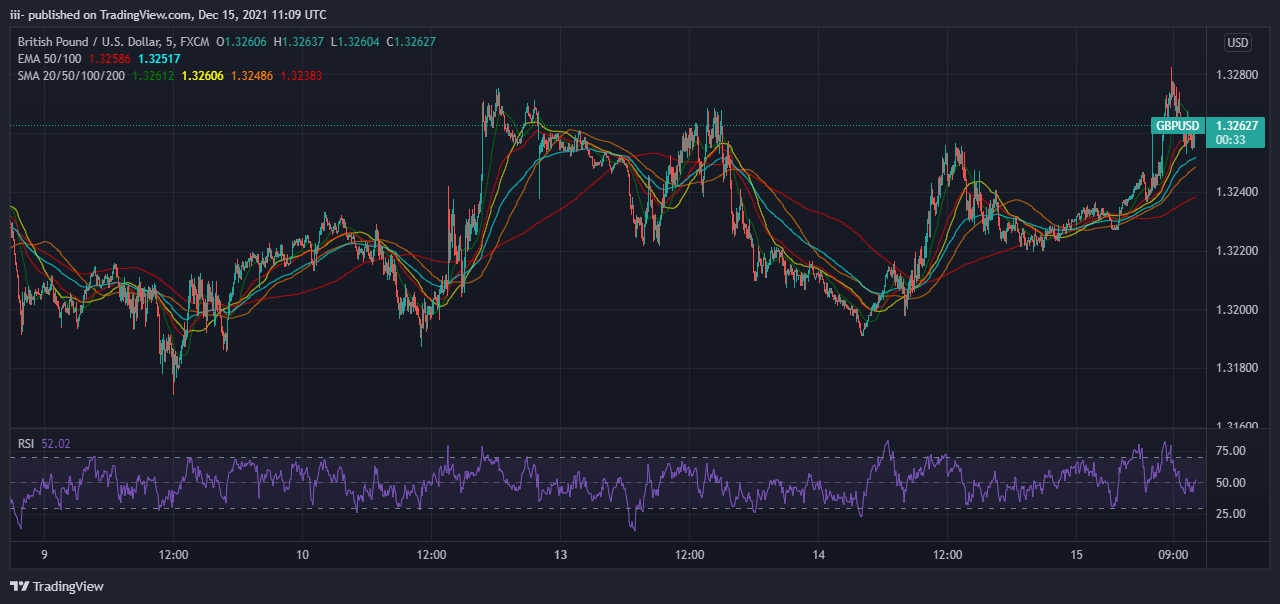
In response to higher-than-expected UK inflation numbers, the Pound rose to a new weekly high in the vicinity of 1.3260–65 before reversing course and falling a few pips after that.
When we last checked, the pair was trading with barely noticeable intraday advances, just under the mid-1.3200s.
Despite the pair seeing some purchasing for the second day in a row on Wednesday, the pairing is now aiming to consolidate on the previous day’s recovery from levels below 1.3200.
The softer tone around the rates on US Treasury bonds put the bulls of the US dollar on the defensive during the first half of the European session.
Consequently, it was seen as a significant factor in providing some support to the GBP/USD pair.
Fundamental Outlook
The pace of intraday purchasing increased when data from the United Kingdom revealed that the headline CPI increased by 0.7% month on month and surged to 5.1% year on year in November.
Furthermore, the core CPI increased by 4% year on year, compared to a 3.4% increase the previous year. The data was much above consensus expectations, which significantly lifted the Pound sterling, while bulls struggled to obtain acceptance above the 200-hour simple moving average (SMA).
Amid further COVID-19 limitations in the United Kingdom, recent data has done nothing to bolster expectations of an immediate interest rate rise by the Bank of England at its forthcoming meeting on Thursday, scheduled for this week.
Because of the continued uncertainty surrounding Brexit has served as a headwind for the Pound sterling and has prevented the GBP/USD pair from achieving any significant gains in value.
Investors also appeared to be reluctant to initiate aggressive wagers, preferring instead to remain on the sidelines as the significant central bank event risks approached.
The Federal Reserve is expected to make its monetary policy decision later in the day in the United States. This will be followed by the Bank of England meeting on Thursday, which will play a critical role in deciding the short-term direction of the GBP/USD exchange rate.
Keep An Eye On The Technical Levels

GBP/USD CHART Source: Tradingview.com
On the upside, the GBP/USD is facing heavy opposition around the 1.3280/1.3300 region, which is where the four-hour chart’s 100-period simple moving average, a static level, and a psychological level all come together.
If a four-hour candle closes above that level, the following targets could be seen at 1.3330 (the current static level) and 1.3390 (the previous moving average) (200-period SMA).
They are located at 1.3230 (20-period SMA, 50-period SMA), 1.3200/1.320 (psychological level), 1.3160 (static level), and 1.3230/1.3190 (psychological level, static level) (December 8 low).
The information provided on this website should not be interpreted as financial or investment guidance and may not embody the perspectives of Forex Tools Trader or its contributors. Forex Tools Trader does not hold responsibility for any financial setbacks experienced due to the use of information provided on this website by its writers or patrons. It's essential to thoroughly investigate and make informed decisions before entering any financial commitments, particularly concerning third-party reviews, presales, and similar ventures. The content you are viewing may be sponsored content, read our full disclaimer to learn more.


